

The Agentic Data Workspace, in Production: Farmioc's Market Intelligence on TridaPad
Most companies that collect serious data eventually discover the same gap. The data exists. The store is well kept. And still, every real question turns into a ticket, an export, or a wait for the one analyst who knows where things live.
Farmioc, the Indian agri-intelligence company, had the data half solved better than most. What runs on top of their DataStore is the part worth writing about: TridaPad, our AI-native data platform, carrying their visualizations, dashboards and agentic analytics in one workspace — working directly on the live store, not on copies of it.
This is the story from the platform side. Farmioc tells it from theirs in their own account, and the two are worth reading together, because they are unusually candid about how awkward the underlying data is.
Start with the data, because it is genuinely awkward
Farmioc's DataStore holds prices and arrivals from agricultural markets across India, government stocks, weather, trade flows, crop estimates and company financials. Almost none of it arrives alike. Prices are quoted per quintal in one market and per candy or bag in another. Arrivals land daily, stocks monthly, financials quarterly. A fertilizer tender is a PDF one day and a price series the next. And the subject refuses to sit still: a monsoon revision in July rewrites what a price in October means. This is the data behind products like PriceHub, which covers prices and forecasts for more than 200 crops across India.
An analytics layer that demands everything be cleaned into one shape before anyone may look at it would have failed on this data — or rather, it would have succeeded at producing exports: cleaned extracts, frozen in spreadsheets, out of date by the time the meeting starts. Farmioc's requirement was the opposite. The working layer had to sit on the store as it is.
The workspace: one platform over the live store
TridaPad connects directly to the DataStore — it works across 50+ source types behind one multi-engine query environment — so visualizations and dashboards run on the live records Farmioc maintains. One copy of the data, always current, with the whole team looking at the same numbers.
Two things follow from that. Dashboards are built once and stay live, instead of being rebuilt around each cycle's export. And queries become shared team assets rather than private files on one analyst's machine, with role-based access deciding who sees what.
You can see the shape of it in the two desks Farmioc runs publicly. The Fertilizer & Agrochemical Market Intelligence desk puts India and global fertilizer prices, import tenders, company financials and market signals in one live dashboard — four series with different sources, units and rhythms, reading as one market, so a urea tender result lands next to the DAP price it will move. The Commodity Price Analytics & Forecasts desk runs price analytics across agricultural markets, and short- and medium-term forecasts on the same platform, with Farmioc's condition built into the view: the forecast travels with the supply, demand, weather and policy factors behind it, so a risk team can test an assumption instead of taking a number on faith.
The agentic layer: asking the DataStore in plain language
The workspace is only half the story. The other half is AgentSQL, TridaPad's agentic analytics layer, and it is the part that changes the working day.
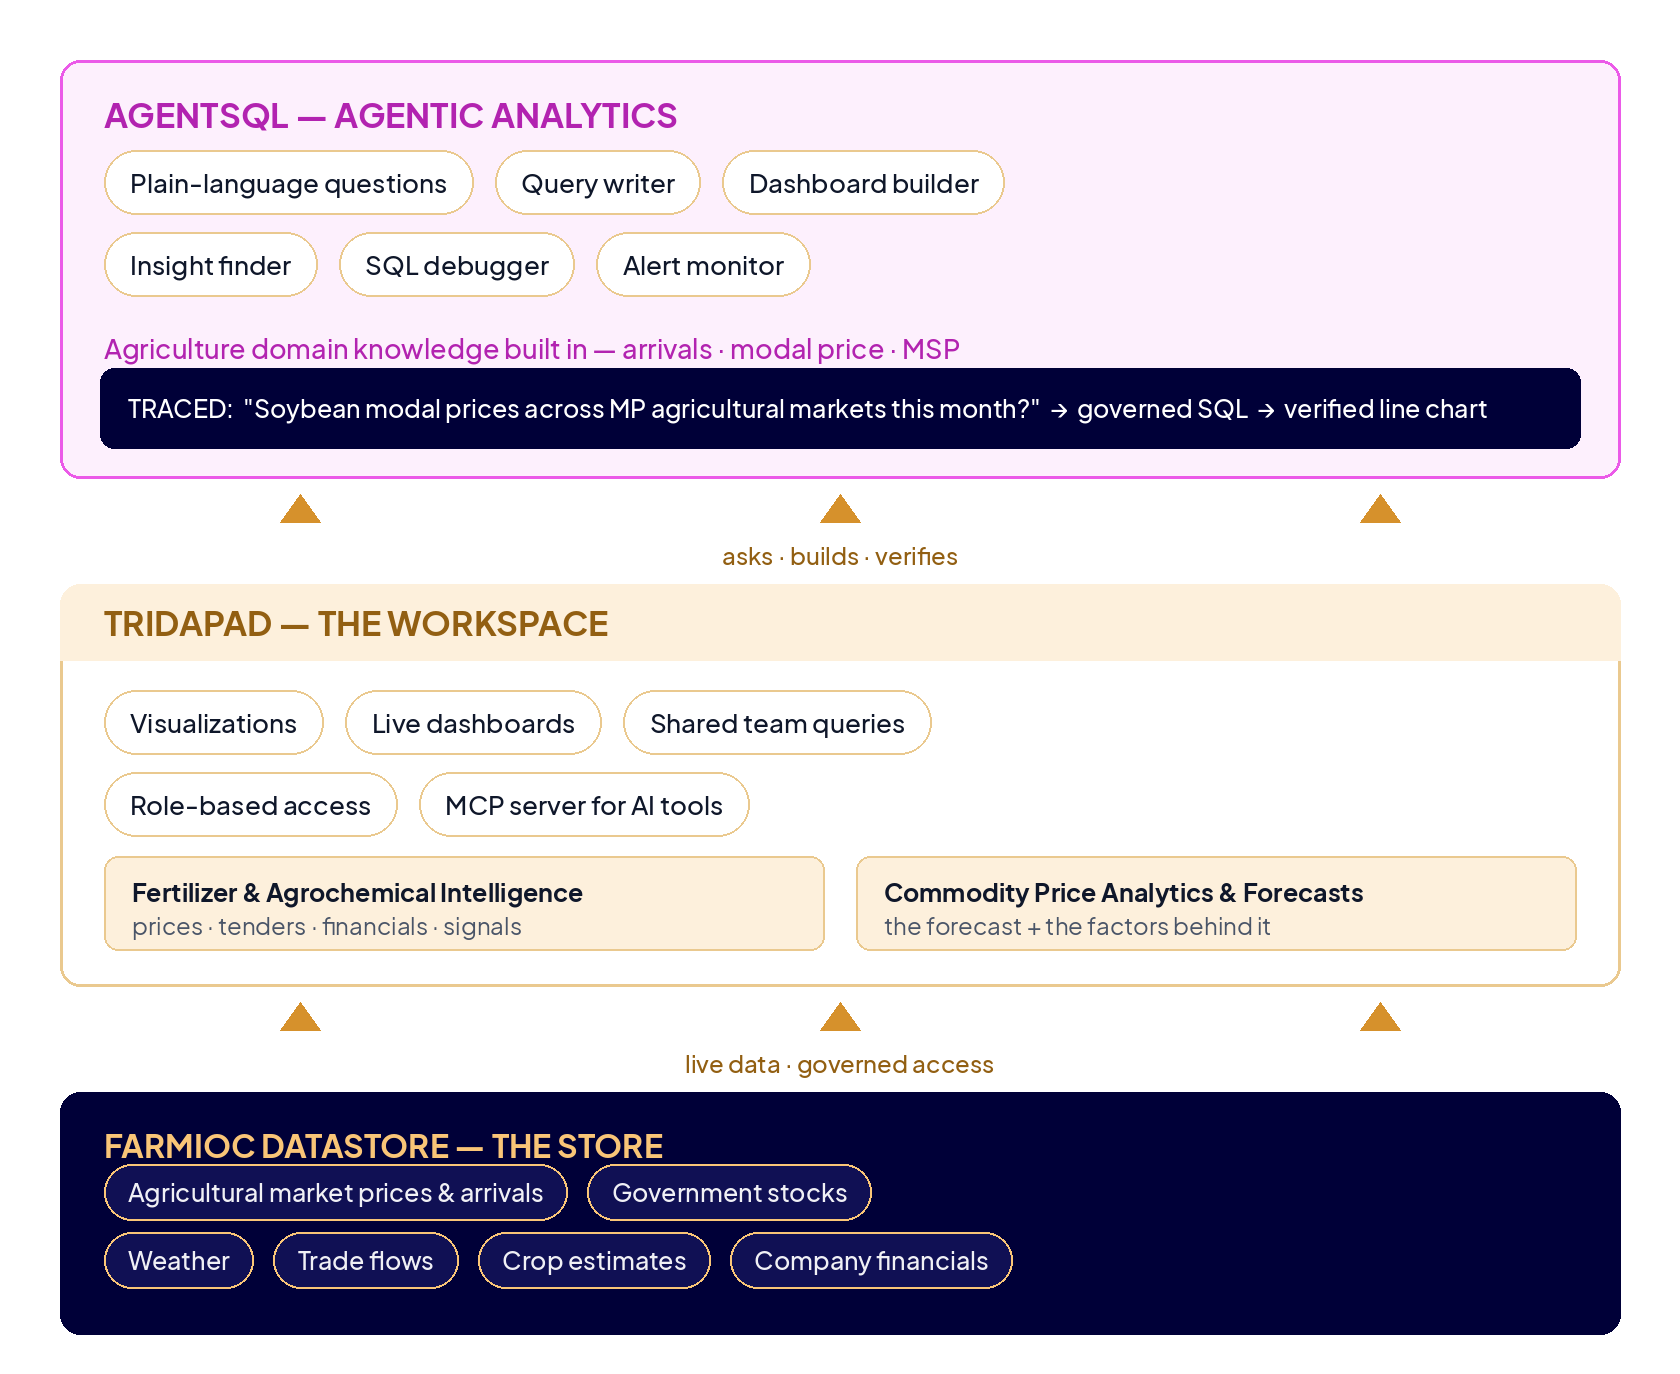
A user asks a question in plain language. AgentSQL discovers the schema on its own, turns the question into governed SQL against the DataStore, builds the chart or dashboard, and verifies the result before presenting it. Underneath, each request is routed to a specialised skill — query writer, dashboard builder, insight finder, SQL debugger, alert monitor — and the agent can surface trends and outliers the user did not think to ask about. TridaPad's MCP server extends the same idea to tooling: AI tools can connect and build dashboards programmatically, under the same governed access as a human analyst.
Two things make this work for agriculture rather than merely work. First, the domain knowledge is built in: AgentSQL carries the vocabulary and metrics of the vertical it runs on, so on Farmioc it understands what arrivals, modal price and MSP mean in a question — the working vocabulary of India's agricultural markets, instead of guessing from general usage. Second, the output is an asset, not an answer in a chat window — a dashboard the team keeps, shares and watches update.
A trace makes it concrete. A trading-desk question — "How did soybean modal prices move across Madhya Pradesh's agricultural markets this month?" — becomes this query against the store:
SELECT market, price_date, modal_price
FROM market_prices
WHERE commodity = 'Soybean'
  AND state = 'Madhya Pradesh'
  AND price_date >= DATE_TRUNC('month', CURRENT_DATE)
ORDER BY price_date, market;
The result is attached to a line chart and pinned to the commodity dashboard. Next week the same dashboard shows the new data, because it was never an export — and the query sits under the chart, where anyone with access can inspect exactly what was asked of the data.
What "agentic" changes — and what it does not
Strip the label away and three practical things change. Routine questions stop being tickets, so analysts keep their hours for the questions that are actually hard. Questions compound: each answer leaves behind a saved query and a live dashboard, so the team's stock of working views grows instead of resetting every Monday. And verification is part of the loop — governed SQL, a checked result, and the query visible under the chart — which is what makes an agent's output usable in front of a procurement head or a lender's risk team.
Honesty about the limits matters as much. The agent cannot repair source data: if a market reports late or a unit is wrong at the source, the chart will faithfully show it until the store is corrected. It cannot settle definitions — what counts as arrivals at a market is Farmioc's decision, made once and written into the governed queries. Access still has to be assigned with care. And none of it substitutes for the DataStore's own discipline: Farmioc's years of collecting and structuring this data are the foundation, and the platform multiplies that work rather than replacing it.
The pattern is the product
Store, workspace, agent — three layers, each with one job. The store keeps the data true. The workspace makes it visible, live and shared. The agent makes it askable, in the language of the people who need the answers.
If your organisation has already done the hard part — the data is collected, and it is still reaching your teams as exports, screenshots and ticket queues — the missing piece is rarely another store. It is the two layers above it.
Try TridaPad — visualizations, dashboards and agentic analytics on the data you already keep. Questions about running it on your own store: data@tridalabs.com.