

From Spreadsheet Chaos to a Live Dashboard in an Afternoon
Every growing company has a file like this. It is called something like Weekly_Sales_FINAL_v5.xlsx, it lives in three inboxes at once, and the Monday review opens with ten minutes of detective work: whose copy is newest, which tab was edited last, and why the total on screen does not match the total someone printed on Friday.
The spreadsheet is not the villain. It did the job when the team was six people and one person knew where every number came from. The problem is what it has quietly become: the company's reporting system. Exports land in it by hand. Formulas get copied one row too far. A filter left on last week becomes this week's missing region. And because the file is a copy, it starts going stale the second it is saved.
You do not fix that with a better spreadsheet. You fix it by going back to where the numbers came from in the first place.
The spreadsheets are copies. Go to the source.
Almost every chaotic workbook is an export in disguise. The sales figures were exported from the orders database. The stock figures were exported from the inventory system. The targets were typed in once, by hand, and then carried forward month after month. Three sources, three exports, one person stitching them together every week — and the stitching is where the errors, the delays and the version arguments all live.
TridaPad removes the stitching step. It connects to 50+ SQL, NoSQL, Big Data and cloud sources once — the orders database, the inventory database, the warehouse, wherever the live data already sits — and the team works on that live data in one shared workspace instead of passing copies of it around. Queries can be saved, searched and shared as team assets, so the definition behind a number is stored with the number, not in the memory of whoever built last week's file. Charts attach to those queries, dashboards assemble from the charts, and a dashboard is shared as one live link rather than another attachment.
That is the whole shift: from a file that someone updates to a dashboard that updates itself.
One afternoon, hour by hour
Take a mid-size distribution company — consumer goods, four regions, a few hundred active product lines — whose Monday review has run on the stitched workbook for two years. The numbers in this worked example are sample numbers; the sequence is the point. Here is the afternoon that replaces the workbook.
1:00 pm — Name the questions before touching the tools. The team writes down the five questions the Monday review actually asks: sales by region this week versus last, top product lines by revenue, which top sellers are low on stock, returns as a share of sales, and sales against target. Not thirty questions. Five. A dashboard that tries to answer everything answers nothing in particular, and the old workbook's fourteen tabs are proof.
2:00 pm — Connect the sources once. The orders and inventory databases are connected in TridaPad, with role-based access deciding who can see what. This is the slow hour, and it is worth saying why: credentials live with IT, one database needs a read-only user created, and someone has to confirm which orders table is the real one and which is the archive nobody mentioned. None of that is wasted time — it is the work the weekly export was hiding — but it happens once, not every Monday.
3:00 pm — Ask the first question in plain language. With the sources connected, AgentSQL takes the first review question as it would be said in the meeting:
"Show weekly sales by region and product line for the last four weeks, with units in stock for each line."
AgentSQL discovers the schema, writes the query, and checks the result before showing it. The core of what it writes, open for the team to read:
-- Weekly sales by region and product line, with current stock
SELECT o.region,
       o.product_line,
       DATE_TRUNC('week', o.order_date) AS week_start,
       SUM(o.net_amount) AS weekly_sales,
       MAX(i.units_in_stock) AS units_in_stock
FROM orders o
JOIN inventory i
  ON i.product_line = o.product_line
WHERE o.order_date >= CURRENT_DATE - INTERVAL '28 days'
  AND o.status = 'completed'
GROUP BY o.region, o.product_line, week_start
ORDER BY week_start, weekly_sales DESC;
The sample result tells the story the workbook used to bury. Overall sales are steady, but two of the top ten product lines in the South region show single-digit days of stock at their current sales rate — a stockout forming two weeks before the spreadsheet review would have caught it, because the stock tab was always the stalest one. The query is saved, named for what it answers, and becomes the first panel on the new dashboard.
4:00 pm — Build the dashboard around the five questions. Each of the remaining four questions becomes a saved query and a chart in the same way — asked in plain language, the SQL read by a human, the result checked against a total the team already trusts from last week's workbook. That cross-check matters. The old file is wrong in process, not necessarily in arithmetic, and matching its trusted totals once is how the team learns the new dashboard can be believed. AgentSQL can also autodiscover insights in the connected data — trends, outliers and anomalies the five questions did not think to ask about — but on day one the team pins only what the review needs.
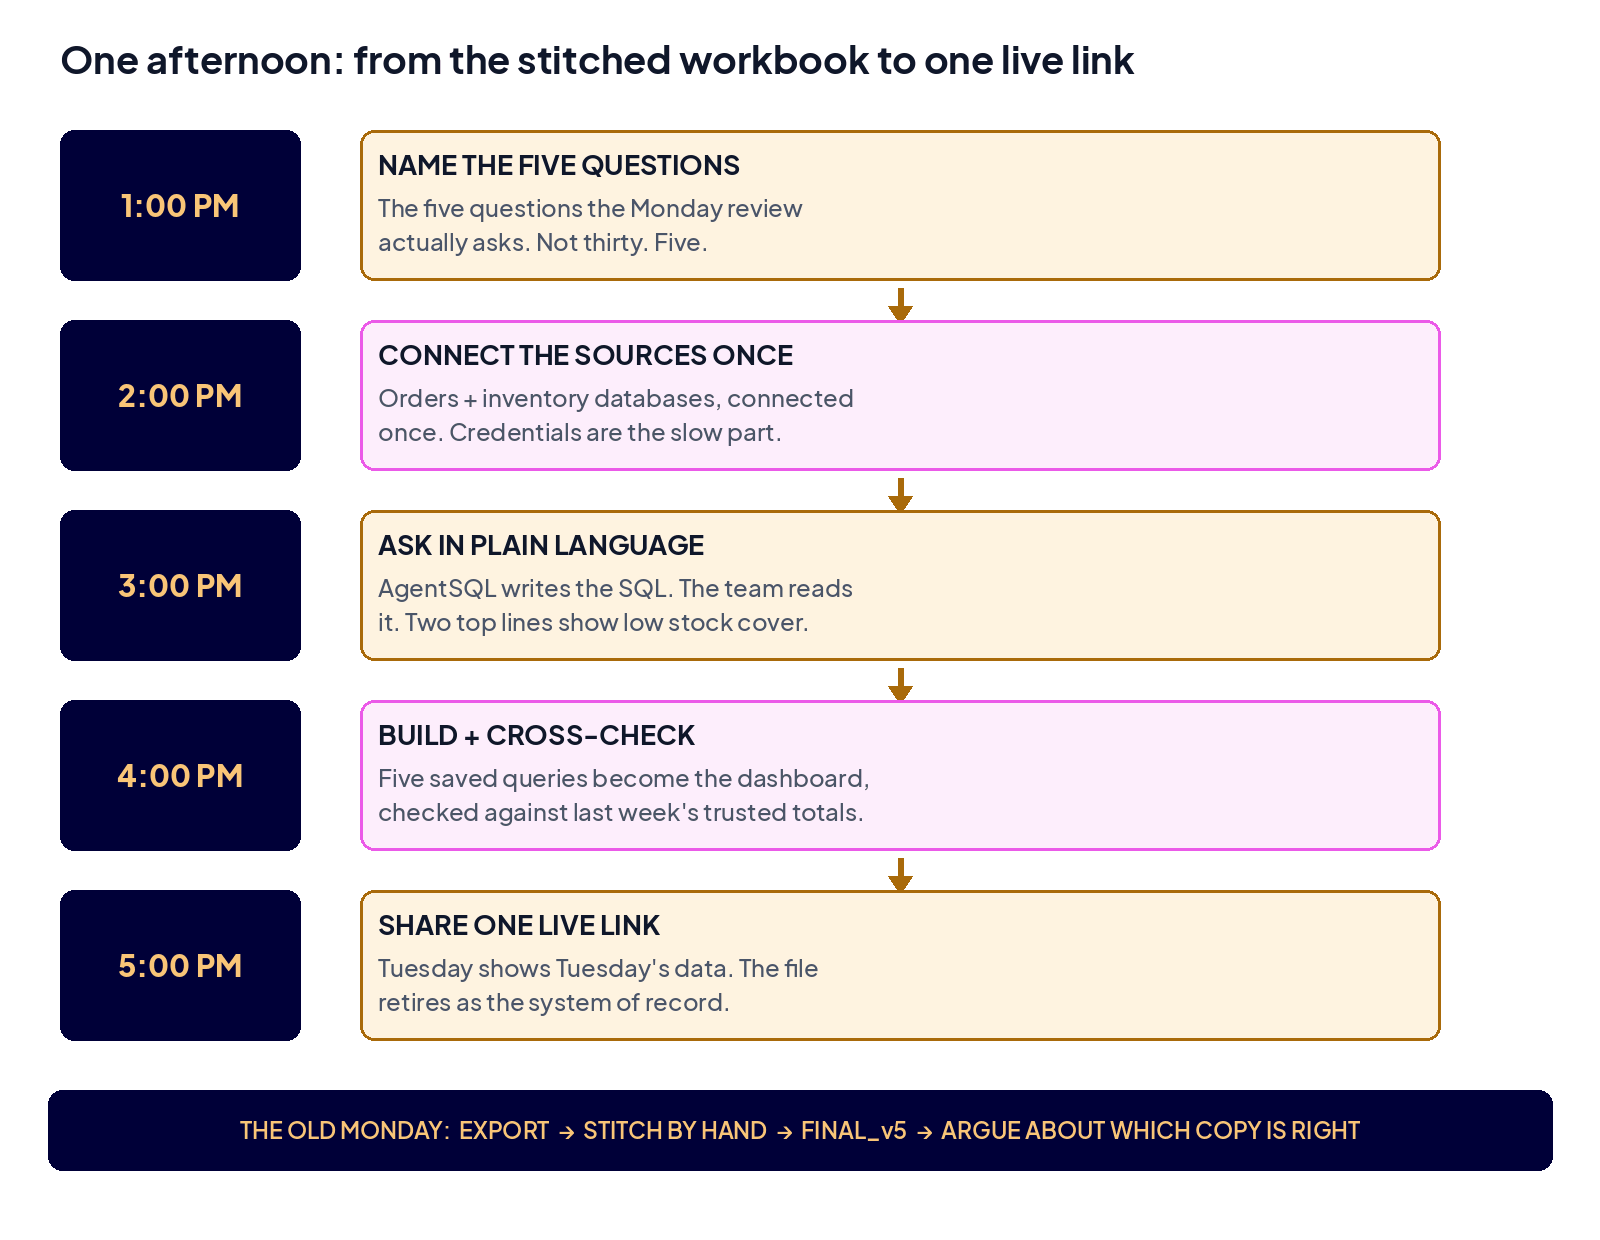
5:00 pm — Share one link, and retire the file. The dashboard goes out as a single live link. On Tuesday it shows Tuesday's data. Next Monday, the review opens the same link and argues about what to do — restock the two lines, shift promotion to a region with cover — instead of which copy of the file is correct. The workbook is not deleted; it is kept as the record of how reporting used to work, and as the cross-check for the first few weeks. What ends is its job as the system of record.
What an afternoon does not fix
Honesty about the limits, because an afternoon is a start, not a migration. First, the targets in our example were typed by hand, and they still are — a number that exists nowhere in a system cannot be connected, only entered, and someone still owns entering it. Second, messy source data stays messy: if two regions spell the same product line differently, the dashboard will faithfully show both until someone cleans the source. Third, one dashboard answers the Monday questions. The finance close, the board pack and the dozen other reports still running on exports are separate afternoons, each with its own five questions. And a live dashboard changes the meeting only if the team lets it — opening the link and trusting it is a habit, and habits take a few Mondays.
What the afternoon does change is structural. The copying step is gone, and with it the version argument, the stale tab and the ten minutes of detective work. The definitions live in saved queries anyone on the team can open and read. The next question — and there is always a next question — is asked of the live data, in the room, not filed as a request for next week's file.
Retire the file this week
If your Monday review starts by establishing which spreadsheet is true, the data is not your problem — the copies are. Pick the five questions your review actually asks, connect the sources behind them once, and let one dashboard answer them live. Try TridaPad with your own five questions — or write to us at data@tridalabs.com and tell us what your FINAL_v5 file is called. We have all had one.