

Every Acquisition Adds a Dashboard. None of Them Agree.
The deal closes on a Friday. By Monday the group has a new company, a new finance lead, a new accounting system — and a new dashboard. That dashboard is not wrong. It is careful, it is maintained, and it answers its own company's questions well. It just defines revenue the way that company has always defined it, which is not the way the other three companies in the group define it.
So the next board meeting opens with a familiar scene. The CFO's pack says one number for the quarter. The newest entity's dashboard says another. Both numbers can be traced. Both numbers are defensible. And the first twenty minutes of the meeting go not to what the business should do, but to which number the room is supposed to believe.
That is not a reporting problem at the edges. It is what growth by acquisition does to data: every deal adds an entity, and every entity brings its own stack, its own chart of accounts, and its own quiet decisions about what counts.
The board pack is a merge, not a report
Look at how a multi-entity board pack actually gets built. Each entity closes its month in its own system. Each finance lead exports the same handful of views — revenue, bookings, cash, headcount cost — into spreadsheets. Someone at group level lines the columns up, maps four charts of accounts into one, removes the sales one entity made to another, and pastes the result into the pack. Next month, the same person does it again, from the new exports.
The structure is the problem. The group's most important numbers live in a merge that exists once a month, in one person's spreadsheet, with the definitions carried in that person's head. Ask why a number moved and the answer starts with archaeology: which export, which mapping, which adjustment.
A live group view does not start with a bigger spreadsheet. It starts by connecting each entity's sources once, in one workspace, and leaving them connected. TridaPad is that workspace: it connects to 50+ SQL, NoSQL, Big Data and cloud sources, so an entity on one database and an entity on another can be queried side by side without either company changing the system it runs its own books on. The entities keep their stacks. The group stops re-merging them by hand.
But connection alone does not make two dashboards agree. The disagreement was never really about access.
Revenue is three numbers until the group pins it to one
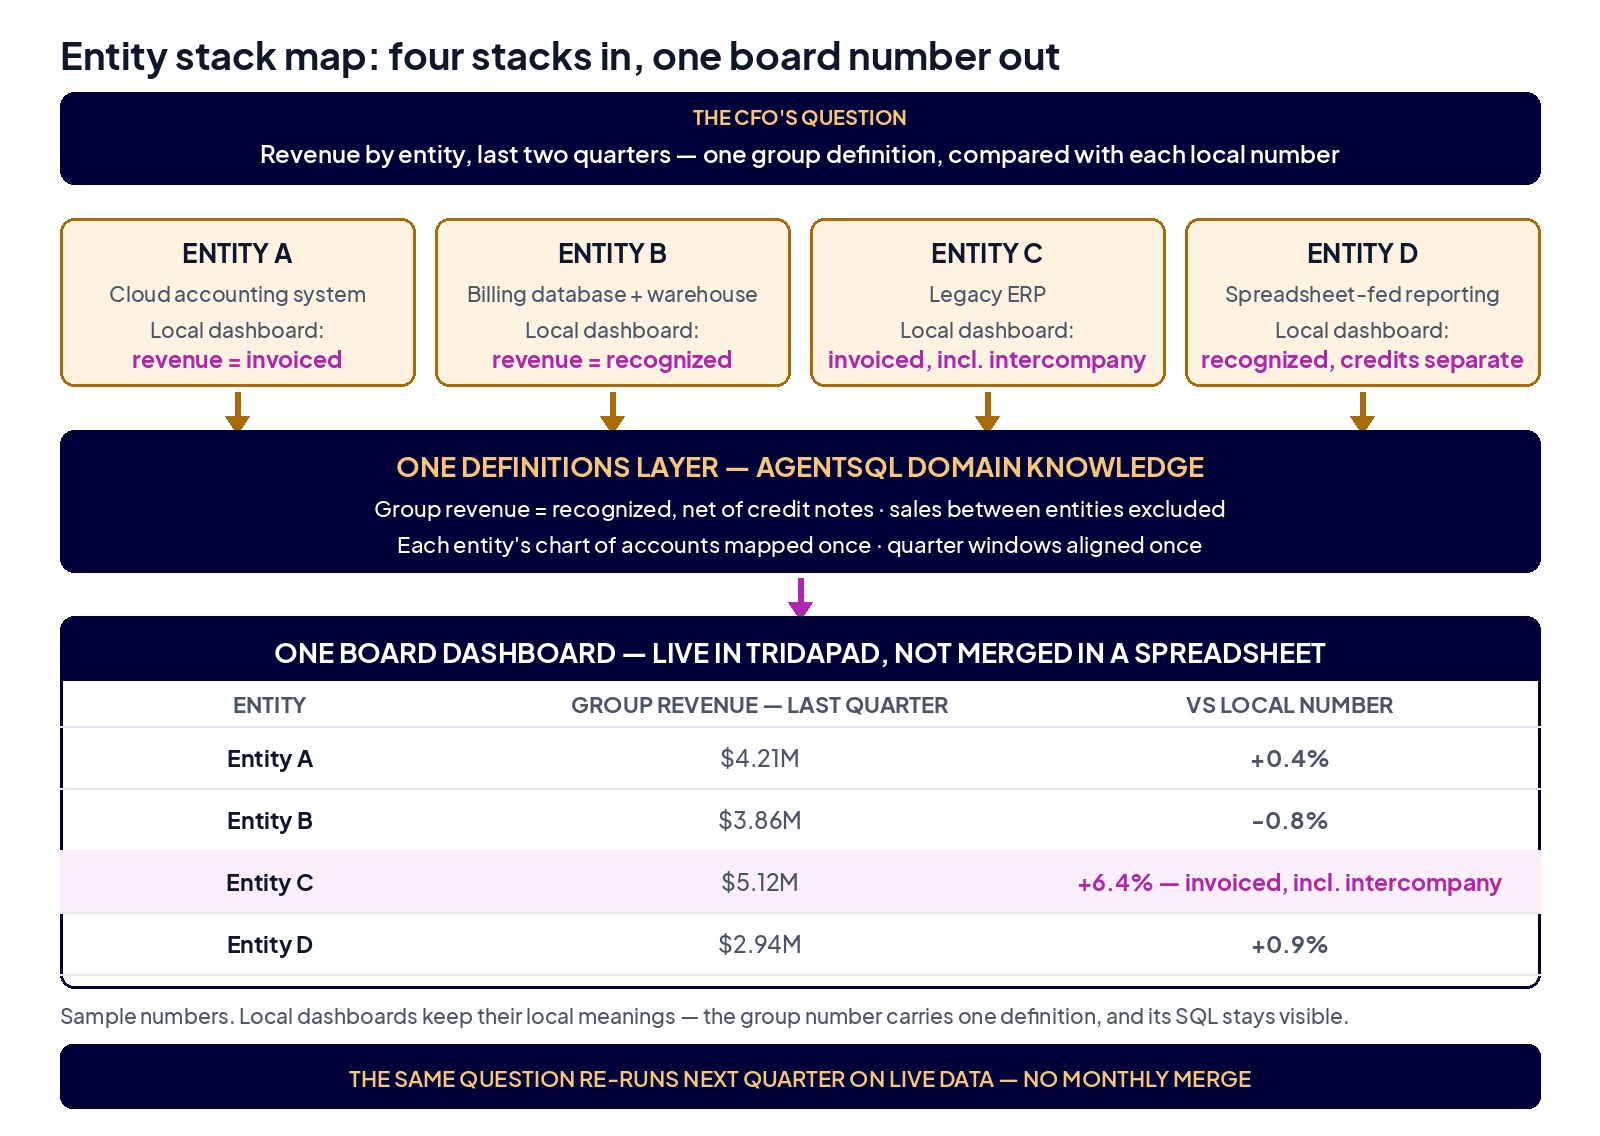
Ask four entities for "revenue" and you get at least three different calculations wearing the same word. One counts invoices issued. One counts revenue recognized. One nets off credit notes; one leaves them in a separate line the group pack sometimes forgets. Two of them sell to each other, so the group's total double-counts that work unless someone removes it by hand. Their quarters even close on different days, so "last quarter" is not quite the same window everywhere.
None of these choices is careless. Each one made sense inside the company that made it. The failure is that the group never made the choice once, together, in a place that outlives the monthly merge.
That is the job of AgentSQL Domain Knowledge at group level. AgentSQL is the agentic analytics layer inside TridaPad — it takes a plain-language question, discovers the schema, writes the SQL, and verifies the result before showing it. Domain Knowledge means the group's vocabulary, metrics and rules are built into that agentic core on the group's own data: revenue defined once — recognized, net of credit notes, sales between entities excluded — each entity's local chart of accounts mapped to that definition once, quarter windows aligned once. The local dashboards can keep their local meanings for local decisions. The group number has one meaning, written down in the layer that generates it, and the SQL behind any figure stays visible for anyone who wants to check how it was built.
One question across four entities, asked once
Take a group that has acquired three companies over two years, so four entities now report into one board. The numbers below are sample numbers; the question is the one its CFO asks every quarter.
"Show revenue by entity for the last two quarters, using the group definition, and compare it with each entity's own local number."
AgentSQL writes it against the mapped group view — each entity's revenue lines already carrying the group fields: the entity, the revenue date, the recognized amount, the credit notes, and a flag for sales made to another entity in the group. One query, open for anyone to read:
-- Group revenue by entity: one definition for every entity
-- recognized revenue, net of credit notes, intercompany sales excluded
SELECT entity_name,
       DATE_TRUNC('quarter', revenue_date)        AS quarter,
       SUM(recognized_amount - credit_amount)     AS group_revenue,
       SUM(local_reported_amount)                 AS local_revenue,
       ROUND(100.0 * (SUM(local_reported_amount)
             - SUM(recognized_amount - credit_amount))
             / NULLIF(SUM(recognized_amount - credit_amount), 0), 1)
                                                  AS variance_pct
FROM group_revenue_lines
WHERE is_intercompany = FALSE
  AND revenue_date >= DATE_TRUNC('quarter', CURRENT_DATE)
                      - INTERVAL '6 months'
GROUP BY entity_name, quarter
ORDER BY quarter, entity_name;
In the sample result, three entities land within a percent of their local numbers — their definitions were close to the group's all along. The fourth is off by more than six percent, and the query shows why instead of hiding it: its local dashboard counts invoiced sales, including a large sale to a sister entity that the group definition removes. That is not an error to be embarrassed about. It is exactly the conversation a board pack should start — one visible gap, with a named reason — instead of two totals that simply refuse to match. The query is saved, its charts become the board dashboard, and the same question re-runs next quarter on live data instead of being rebuilt from exports. AgentSQL can also autodiscover insights across the connected entities — an entity quietly drifting from the group on margin or collections shows up as a pattern to look at, not a surprise in the merge.
What changes when the board pack is a dashboard
The monthly merge shrinks to its honest remainder. Finance still closes each entity's books — that work does not move. What disappears is the second, shadow close at group level: the exports, the column-lining, the mapping from memory. The CFO opens one dashboard where every entity's revenue sits under the same definition, and a follow-up — by entity, by quarter, group definition against local — is a question typed in plain language, not a request sent back down the chain for next week.
New acquisitions get cheaper to absorb, too. The next deal still brings its own stack and its own dashboard, and it can keep both. Onboarding it to the group view is now a defined piece of work: connect its sources, map its chart of accounts to the group definitions once, and its numbers join the board dashboard under the same rules as everyone else's. The group stops dreading the reporting cost of the next deal, because the cost is paid once per entity instead of every month forever.
What this does not fix
Honest limits. First, the definitions still have to be agreed by people: a CFO and four finance leads have to sit down and decide what group revenue means, including the awkward cases — that meeting is the work, and software only makes its outcome stick. Second, mapping a messy chart of accounts is real one-time work; an entity that has booked the same kind of sale three ways in three years will need those untangled, and the dashboard will show the untangling honestly rather than smooth it over. Third, this does not close anyone's books faster: an entity that closes late still arrives late, it just arrives into a live dashboard instead of a merge. And intercompany eliminations carry accounting judgment — the flag in the query is only as good as the mapping behind it. The tool makes one definition enforceable. Agreeing on it remains a human decision, taken once, on purpose.
Make the next acquisition add a company, not a contradiction
If your board pack is a monthly merge and your entities' dashboards argue with each other, the problem is not effort or talent — it is that the group has never pinned its definitions in a place that generates the numbers. Connect each entity once, agree the definitions once, and let the board read one live dashboard. Try TridaPad on your own entities — or write to us at data@tridalabs.com and tell us which two dashboards in your group disagree the most.