

Agri Input Companies Sit on Sales Data They Cannot Read
An agri input company's year has hard edges. A seed hybrid that misses its sowing window does not sell a month later at a discount; it sits in a dealer's godown until next year. A crop-protection product that arrives in the district after the pest pressure peaks is not late revenue — it is a return, a complaint, and a dealer who orders less next season.
So the season review matters, and in most mid-size input companies it runs like this. Billing data comes out of the ERP. Dealer stock comes from depot reports. What actually sold through to farmers — secondary sales — arrives in field-team spreadsheets, each territory manager keeping a slightly different format. Someone in head office stitches the three together, argues about which district a border dealer belongs to, and produces the review pack somewhere in week six of a twelve-week season. By then, half the decisions the pack was meant to inform have already been made by phone and gut feel.
The company is not short of data. It billed every bag. It is short of a way to read that data while the season is still open.
The data exists. The reading is what is late.
Look at where an input company's numbers actually live. Primary sales — company to distributor or dealer — sit in the ERP, clean and invoiced. Depot and warehouse stock sits in the same system or a second one. Secondary sales, dealer to retailer or farmer, live wherever the field team puts them: a reporting app in one region, spreadsheets in another, phone calls in a third. Product masters carry three spellings of the same hybrid. District boundaries in the ERP do not always match the territories the sales team actually works.
None of that is unusual, and none of it needs a data platform rebuild before it can be read. It needs the sources connected once, in one workspace, and a way to ask questions that understands how this business talks. TridaPad is that workspace: it connects to 50+ SQL, NoSQL, Big Data and cloud sources, and the team queries, charts and shares dashboards on the live data instead of exporting it into another round of spreadsheets.
But connecting the tables is only half the problem. The other half is vocabulary.
A generic query tool does not know what a season is
Ask a generic analytics tool about "last season" and it has to guess. In this business, season is not a quarter. Kharif and rabi are different crop calendars, different product mixes and different dealer behaviour — and the same hybrid can be a kharif product in one territory and irrelevant in another. "Sales" is ambiguous too: primary billing, secondary movement and farmer offtake are three different numbers, and a territory review that mixes them up is worse than no review at all. A district is a revenue unit, a territory is a person's patch, and they are not the same shape.
That gap is what AgentSQL Domain Knowledge is built to close. AgentSQL is the agentic analytics layer inside TridaPad — it takes a plain-language question, discovers the schema, writes the SQL, and checks the result before showing it. Domain Knowledge means the domain's vocabulary, metrics and rules are built into that agentic core on the company's own data: season defined the way the company defines it, product categories mapped once (seed, fertiliser, crop protection, by crop and hybrid), primary and secondary sales kept distinct, districts rolled up to territories and regions the way the sales team actually works. The question gets asked in the language of the season review, and the SQL comes back using the company's definitions — visible, readable, and saved with the dashboard, so the definition behind a number is never locked in one analyst's head.
One territory question, asked in week two instead of week six
Take a mid-size input company selling seed and crop protection through dealers across several dozen districts. The numbers below are sample numbers; the question is the one its sales head actually asks every season.
"Which districts sold less hybrid seed this kharif than last kharif, and which of those already hold more than six weeks of dealer stock cover?"
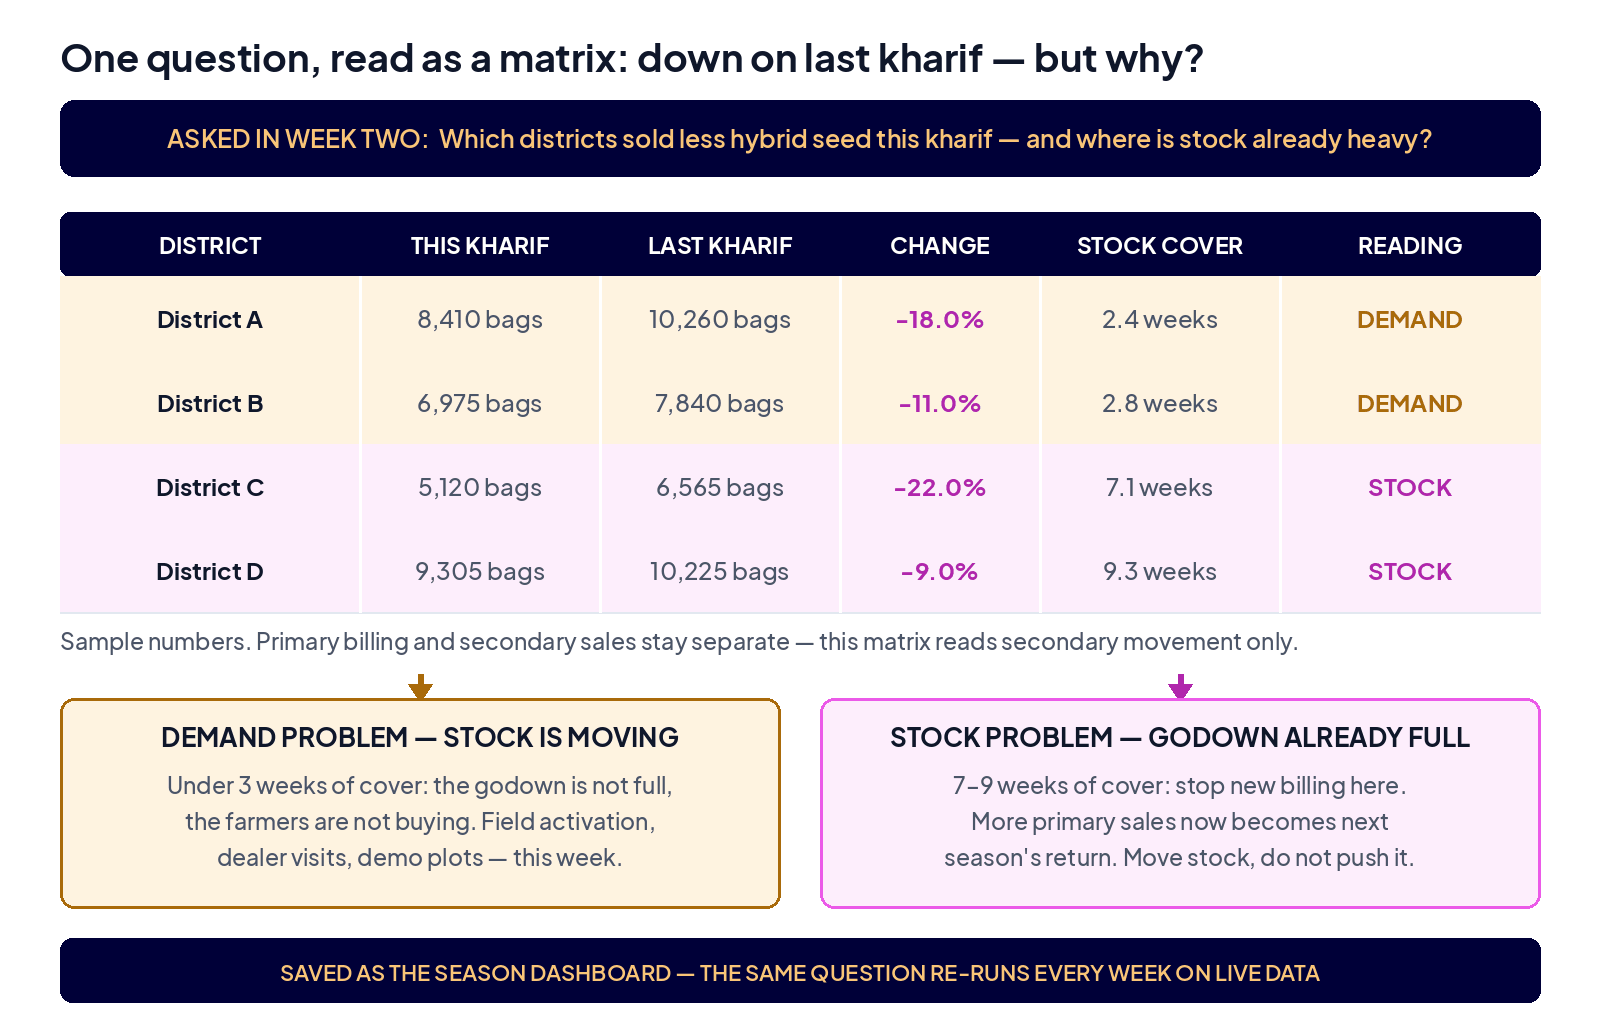
That is really two questions folded into one sentence: a season-on-season sales comparison, and a stock-cover check on the districts that are slipping — because under-selling with low stock is a demand problem, while under-selling with a full godown is next season's return problem. AgentSQL writes it as one query, open for anyone to read:
-- Districts down on hybrid seed vs last kharif, with dealer stock cover
SELECT s.district,
       SUM(s.net_quantity)                          AS this_kharif_qty,
       SUM(p.net_quantity)                          AS last_kharif_qty,
       ROUND(100.0 * (SUM(s.net_quantity) - SUM(p.net_quantity))
             / NULLIF(SUM(p.net_quantity), 0), 1)   AS change_pct,
       ROUND(MAX(d.stock_on_hand)
             / NULLIF(SUM(s.net_quantity) / 12.0, 0), 1) AS weeks_of_cover
FROM secondary_sales s
JOIN product_master pm
  ON pm.product_code = s.product_code
 AND pm.category = 'seed'
 AND pm.crop_segment = 'hybrid'
LEFT JOIN secondary_sales p
  ON p.district = s.district
 AND p.product_code = s.product_code
 AND p.season = 'kharif_last_year'
JOIN dealer_stock d
  ON d.district = s.district
 AND d.product_code = s.product_code
WHERE s.season = 'kharif_current'
GROUP BY s.district
HAVING SUM(s.net_quantity) < SUM(p.net_quantity)
ORDER BY change_pct ASC;
In the sample result, four districts are down on last kharif. Two of them hold under three weeks of cover — the stock is moving, the demand is not, and that is a field-activation conversation. The other two hold seven and nine weeks of cover respectively: pushing more billing into them would flatter this month's primary number and guarantee a return conversation later. That distinction — same red sales line, opposite actions — is the whole value of asking while the season is open. The query is saved, its charts become the season dashboard, and the same question re-runs every week on live data. AgentSQL can also autodiscover insights across the connected sources — a district whose crop-protection sales spike while its seed sales fall is a pattern worth surfacing before the review, not during it.
What changes when the review runs on live data
The weekly territory review stops being a stitching exercise. The sales head opens one dashboard: season sales by district against the same season last year, stock cover beside it, primary and secondary kept visibly separate. Territory managers ask their own follow-ups in plain language — by dealer, by hybrid, by week — instead of filing requests with head office and getting an answer after the moment has passed. And because the definitions were agreed once, in the Domain Knowledge layer, the argument in the room moves from "whose number is right" to "what do we move, where, this week" — which is the argument a season review exists to have.
What this does not fix
Honest limits, because software does not run a field season. First, secondary sales data is only as good as dealer reporting: a dealer who reports late or not at all leaves a hole no query can fill, and the dashboard will faithfully show that hole rather than invent a number. Second, the season and product mappings have to be agreed once, by people who know the business — if two regions genuinely run different season calendars, that difference belongs in the definitions, not in a spreadsheet footnote. Third, the largest forces in a season — rain, pest pressure, crop prices — live outside the ERP; this reads the company's own sales and stock truth, it does not forecast the weather. And a dashboard asked in week two only helps if someone acts in week two. The tool shortens the distance between the data and the question. Walking it is still the team's job.
Ask the season question while the season is open
If your season review arrives in week six, built from three stitched exports, the problem is not effort — it is that your sales data cannot be read at the speed the season moves. Connect the sources once, teach the questions your own vocabulary, and ask them in week two. Try AgentSQL on your own territory data — or write to us at data@tridalabs.com and tell us which district question you wish you could ask today.