

A League Table for Hotels: Ranking Every Property Against Budget

Ask a hotel group's revenue head a simple question in the second week of the month — which of our properties are tracking below budget, and by how much? — and watch what happens. The answer exists. It is sitting in twelve property inboxes, in twelve spreadsheet formats, waiting for someone at head office to consolidate it. By the time the ranking is built, the month it describes is over.
The ranking itself is not complicated. Every property has a budget for the month. Every property sells rooms against it. The gap between the two, property by property, is the league table — the single most useful page in group reporting. What makes it hard is never the arithmetic. It is that the arithmetic lives in too many places, and gets done too late to act on.
Three numbers per property
A league table row needs three numbers, and they come from three different rhythms of the business.
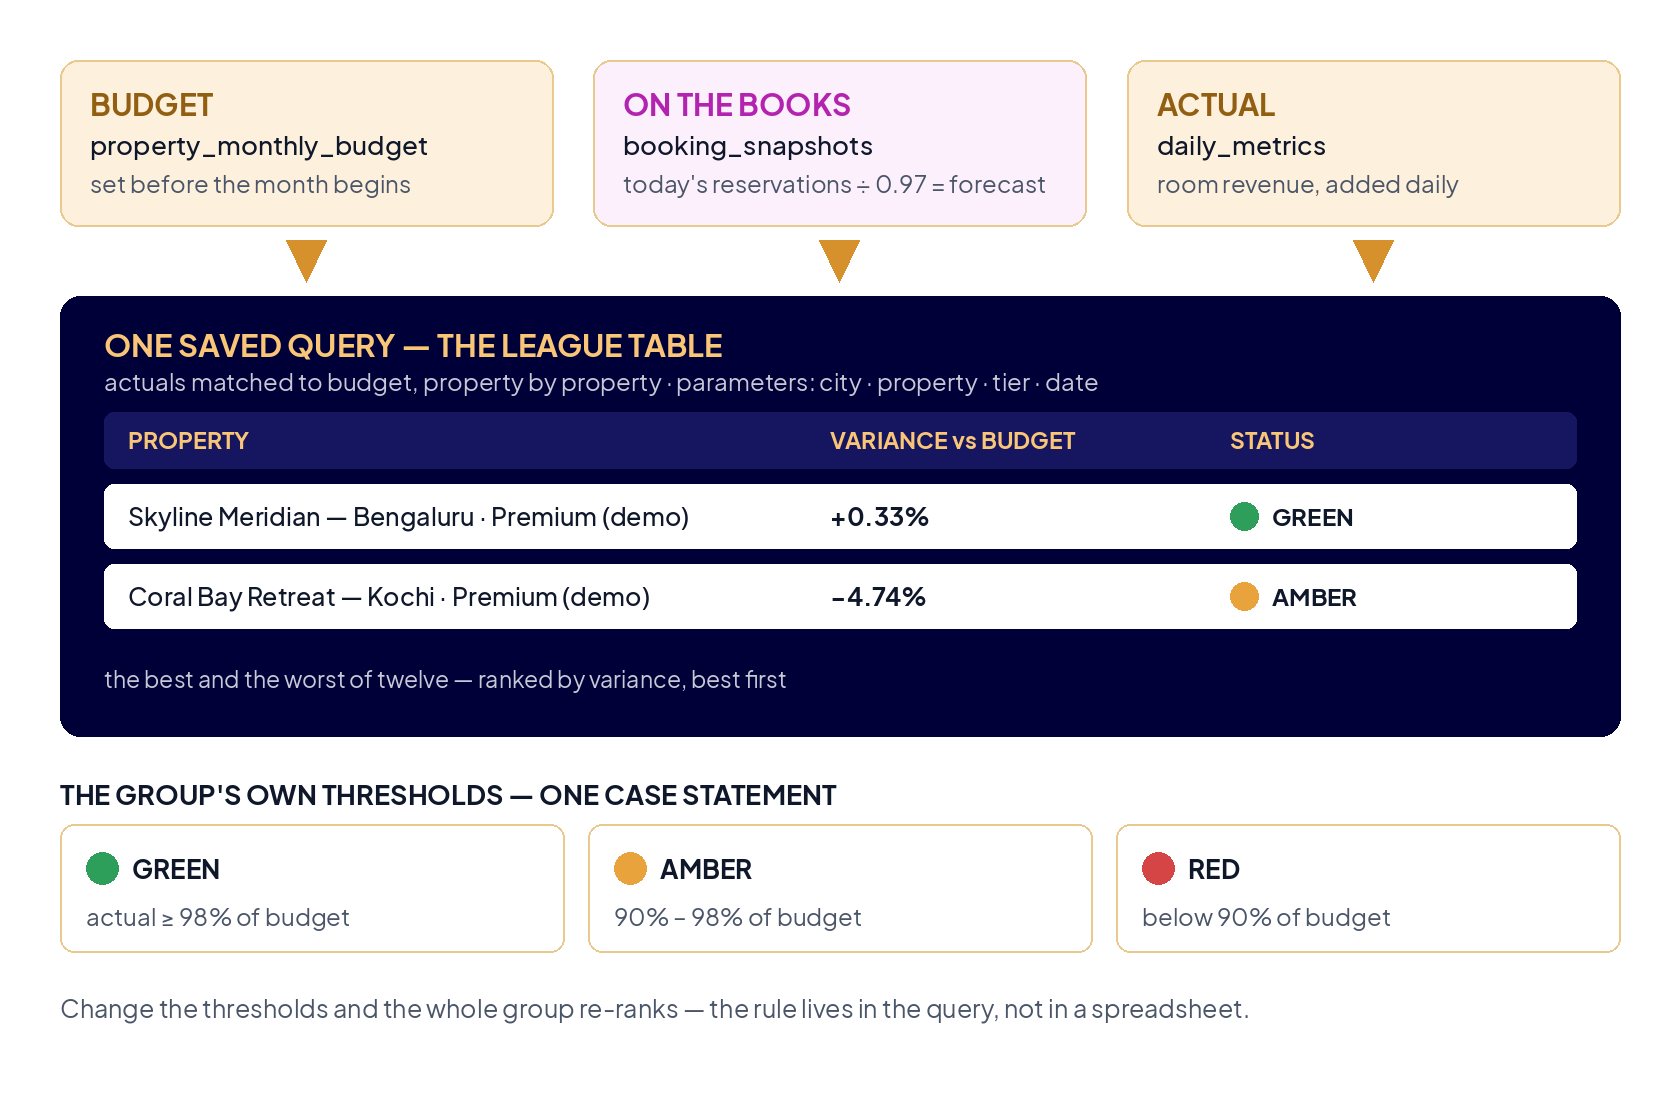
Budget is set before the month begins — property by property, month by month. It barely changes. Actual room revenue accumulates daily, as rooms are sold and nights are stayed. And between them sits the number most group reports skip entirely: the on-the-books projection. Reservations already made today, for stays later this month, are tomorrow's revenue in draft. Divide the revenue currently on the books by 0.97 — allowing roughly three percent to wash out in cancellations and no-shows — and you have a forecast that updates itself every day, from data the group already has.
On TridaPad, a hotel group's reporting sits on these three feeds at once: daily property metrics, the monthly budget table, and booking snapshots (the on-the-books position, captured day by day). The workspace does not ask anyone to export anything. The tables the properties already produce are the tables the dashboard reads.
The league table is one query
Here is the league table, essentially as it runs. Actuals for the quarter are matched against budget, property by property; the variance becomes a percentage; and a RAG status falls out of two thresholds the group chose — at or above 98 percent of budget is Green, at or above 90 is Amber, below that is Red:
WITH monthly_actual AS (
    SELECT property_id,
           date_trunc('month', date)::date AS month,
           SUM(room_revenue_inr) AS actual_revenue_inr
    FROM daily_metrics
    WHERE date >= DATE '2026-08-01' AND date < DATE '2026-11-01'
    GROUP BY property_id, date_trunc('month', date)::date
),
matched AS (
    SELECT b.property_id,
           SUM(b.budget_room_revenue_inr) AS budget_revenue_inr,
           SUM(a.actual_revenue_inr)     AS actual_revenue_inr
    FROM property_monthly_budget b
    JOIN monthly_actual a
      ON a.property_id = b.property_id AND a.month = b.month
    GROUP BY b.property_id
)
SELECT p.name AS property, p.city, p.tier,
       ROUND(m.budget_revenue_inr, 2) AS budget_inr,
       ROUND(m.actual_revenue_inr, 2) AS actual_inr,
       ROUND(100.0 * (m.actual_revenue_inr - m.budget_revenue_inr)
             / NULLIF(m.budget_revenue_inr, 0), 2) AS variance_pct,
       CASE
           WHEN m.actual_revenue_inr >= 0.98 * m.budget_revenue_inr THEN 'Green'
           WHEN m.actual_revenue_inr >= 0.90 * m.budget_revenue_inr THEN 'Amber'
           ELSE 'Red'
       END AS rag_status
FROM matched m
JOIN properties p ON p.property_id = m.property_id
ORDER BY variance_pct DESC;
Nothing about this is exotic SQL. That is the point. The query is saved once, given parameters — city, property, brand tier, date — and it stays live over the same tables the group already maintains. The revenue head filters to one city, or one tier, and the ranking rebuilds itself. Our public demo of this dashboard — twelve properties on sample data — shows exactly this table at the bottom of the page: eight properties Green, four Amber, the worst of them a fraction under five percent below budget. Nobody consolidated anything to produce it.
Pace: the forward-looking half
A league table still describes the past. The other half of the same dashboard looks forward, and it works because of one unglamorous habit: taking a snapshot of the booking book every day.
With snapshots kept, "how is October building?" stops being a feeling. The query lines up the two Octobers — this year's and last year's — by days before the stay month: rooms on the books sixty days out, thirty days out, ten days out. If this October's curve sits below last October's at the same distance, the group has a demand problem while there is still time to price, promote, or push a channel. If it sits above, the conversation changes. The same snapshot table feeds the forecast column: the latest snapshot before each stay month, divided by 0.97, is the on-the-books projection that sits between budget and actual.
Around these two anchors, the rest of the group view assembles itself: occupancy, ADR and RevPAR trends; RevPAR ranked by property; channel mix — direct, OTA, corporate, walk-in — as it shifts month to month; pickup in the last thirty days, property by property. Fourteen views, one set of tables, all reading the same numbers. The argument in the review meeting moves from whose figures are right to what to do about the Amber properties — which was the meeting's job all along.
Asking, in the group's own words
The vocabulary of this business is specific: RevPAR is not revenue, pickup is not pace, and a property "on the books" for October is a different fact from October's actuals. This is where AgentSQL earns its place. On a customer's own data, Trida Labs builds that vocabulary — the metrics, the definitions, the rules like the 98/90 RAG thresholds — into the agent's domain knowledge. So the revenue head's question — show me the properties below 90 percent of budget this quarter, and how their pace compares to last year — is written as the SQL above, run under the team's own permissions, and returned as the table and the chart, not as a paragraph of confident prose. The agent drafts; the human reads the numbers.
None of this removes the group's real work. Budgets still have to be set honestly. A property five percent under budget still needs a manager with a plan, not a redder dashboard. What changes is the timing: the ranking exists in the second week of the month, while the month can still be saved — and it rebuilds itself every day after, without a single consolidation spreadsheet.
If your group's reporting runs on month-end consolidation, Try TridaPad — connect the tables you already have, save the league-table query once, and let the ranking keep itself current. For the questions behind the ranking, that is what AgentSQL is for. Or write to us at data@tridalabs.com.